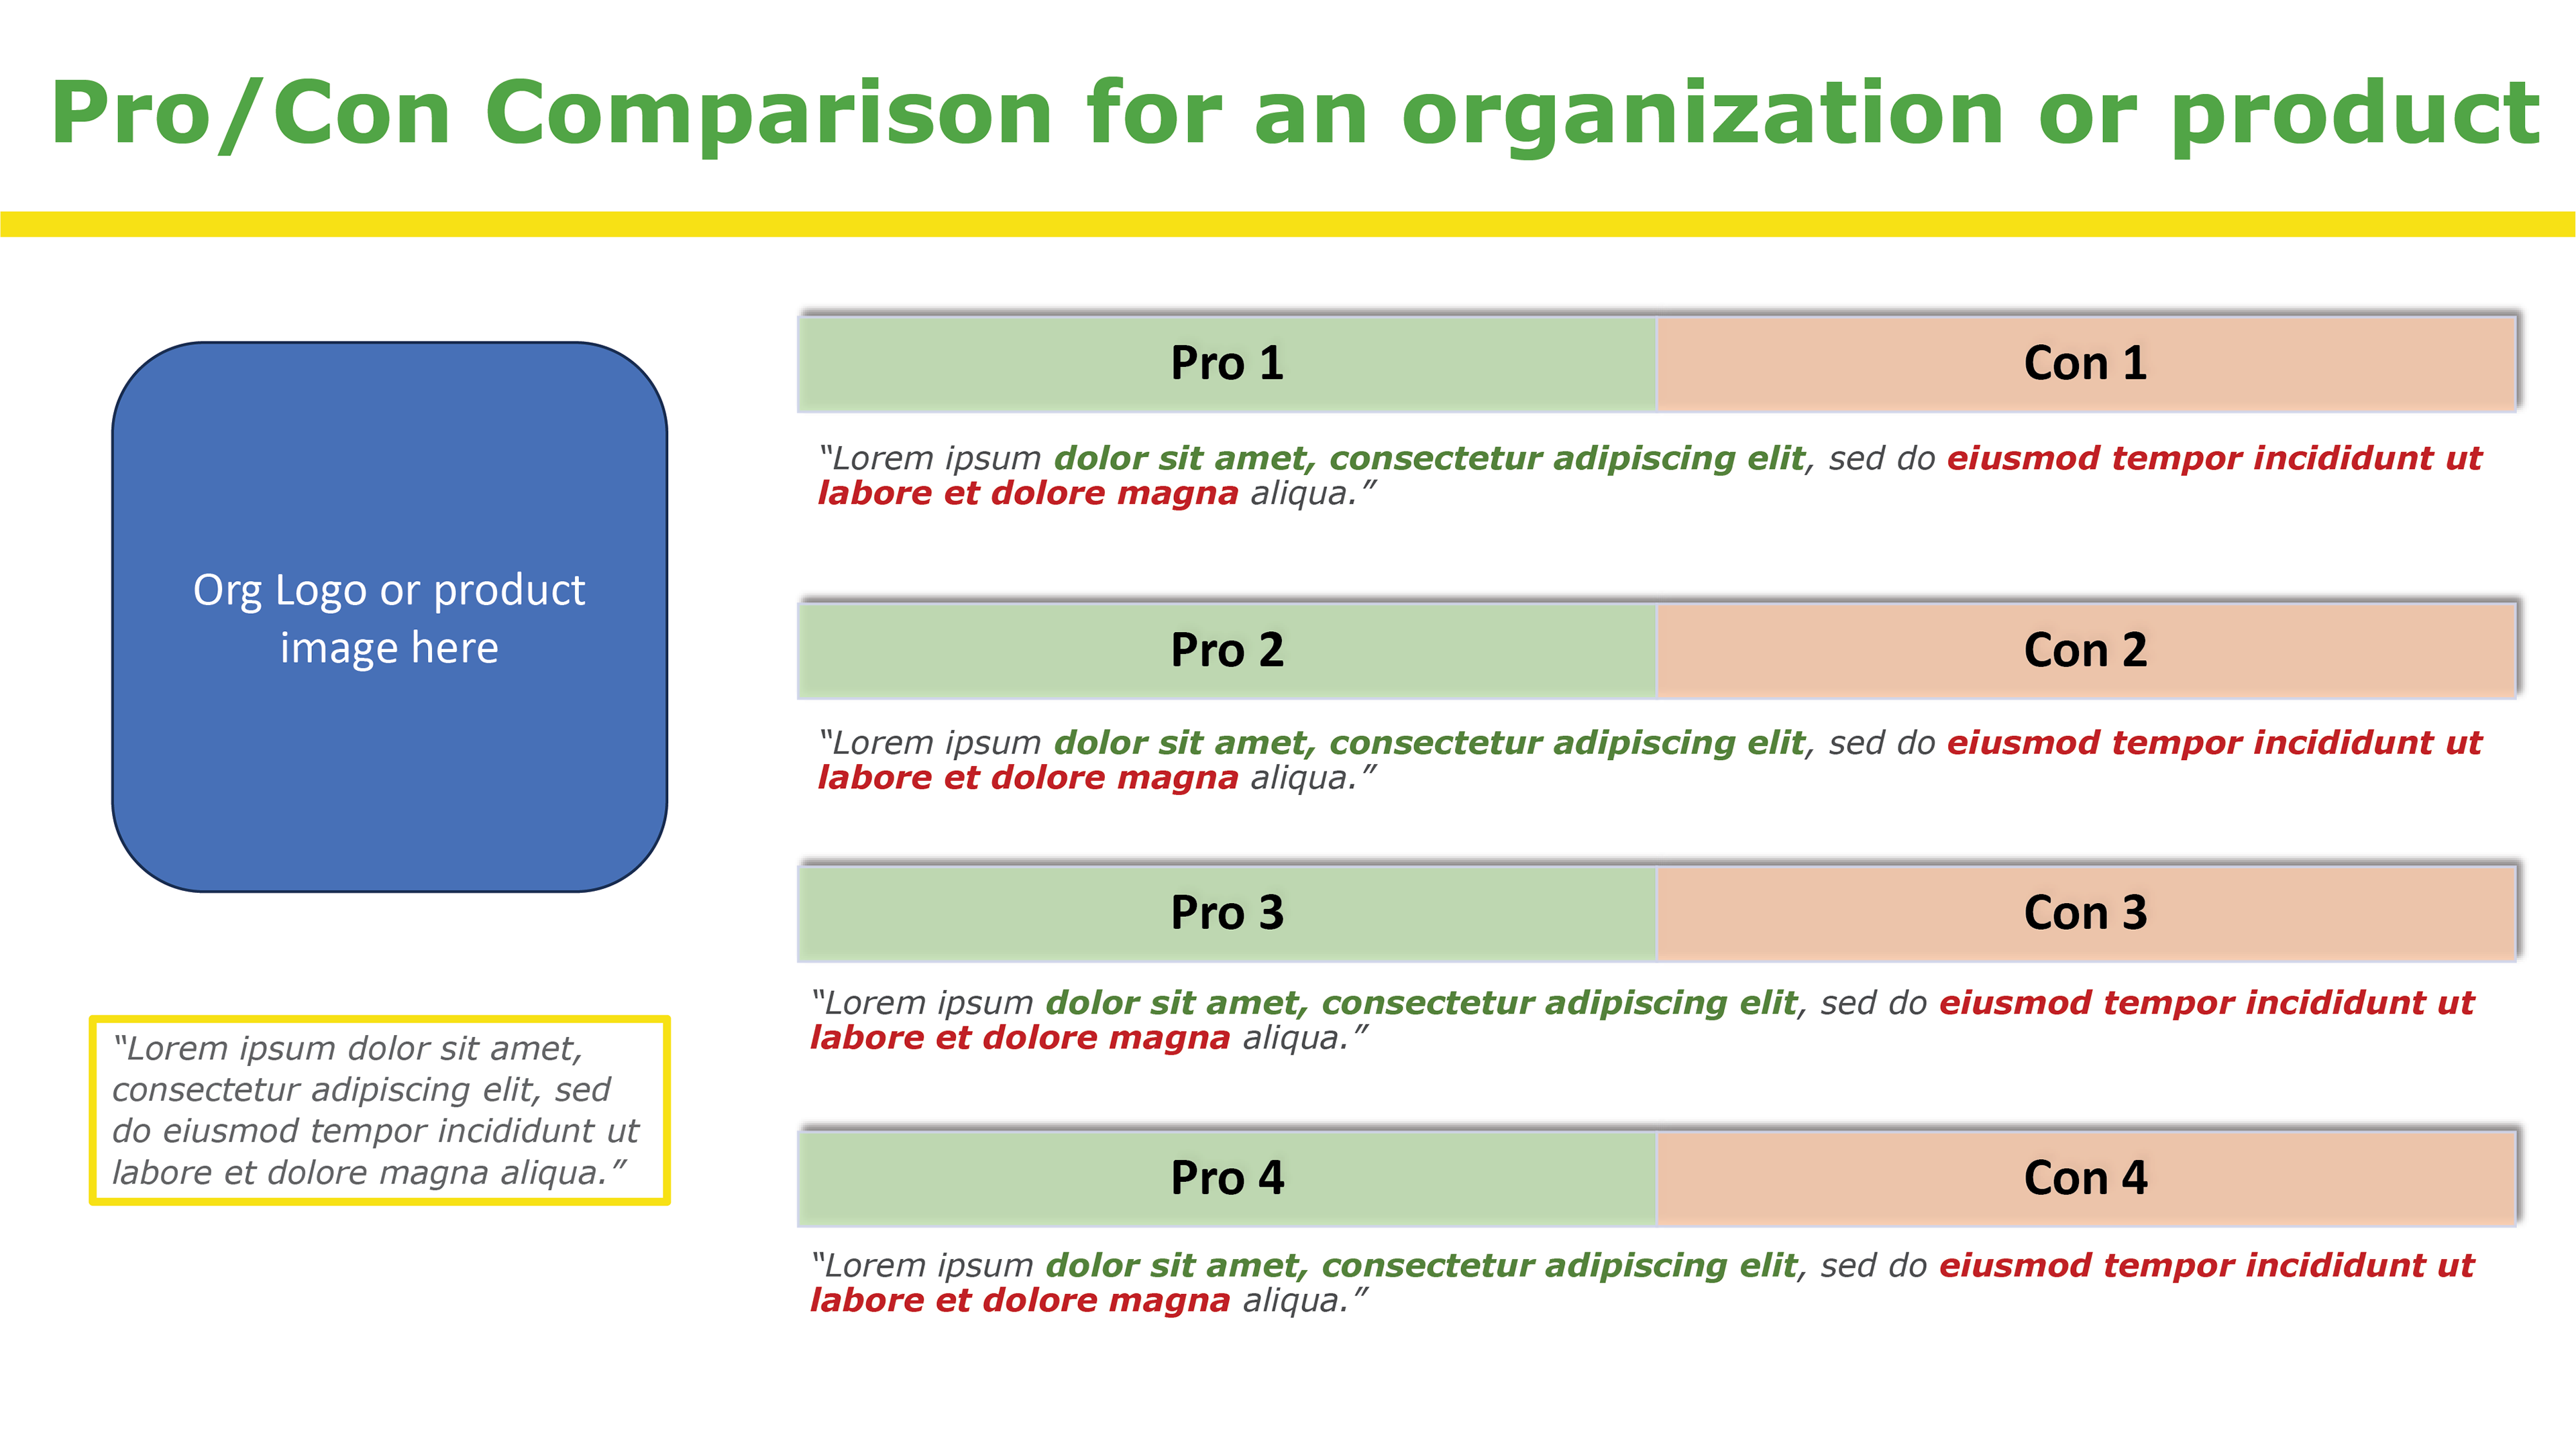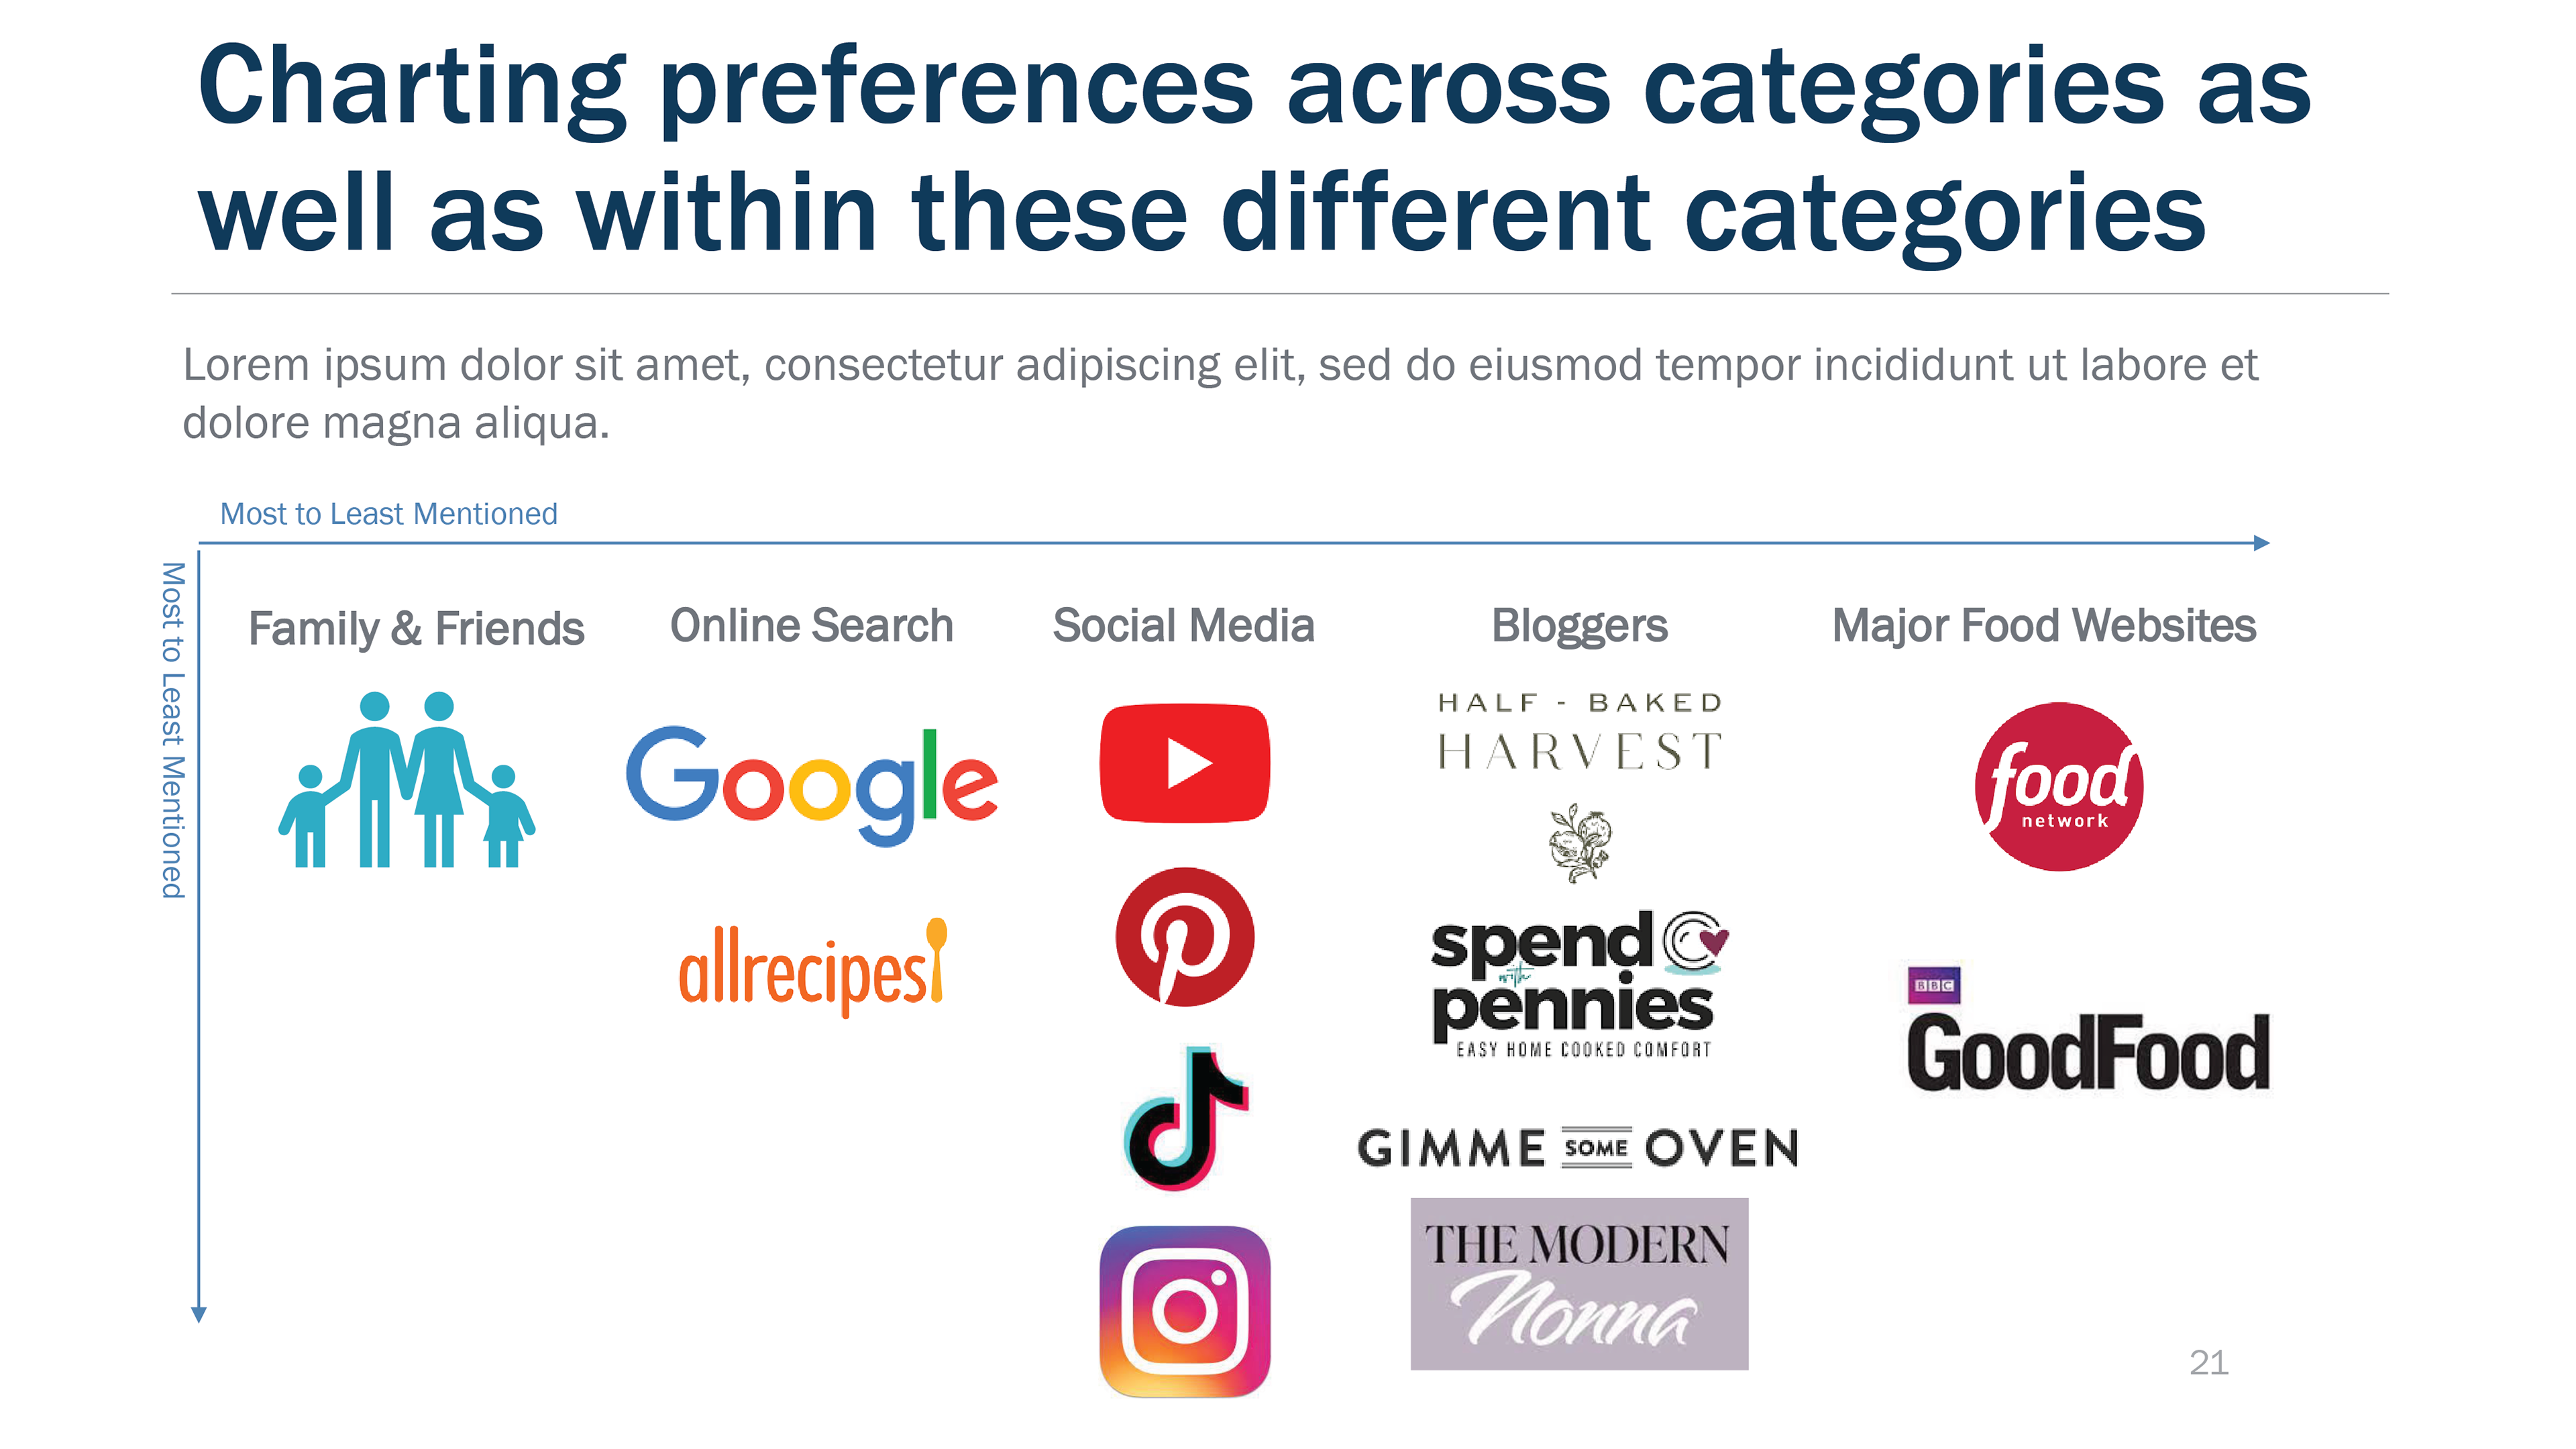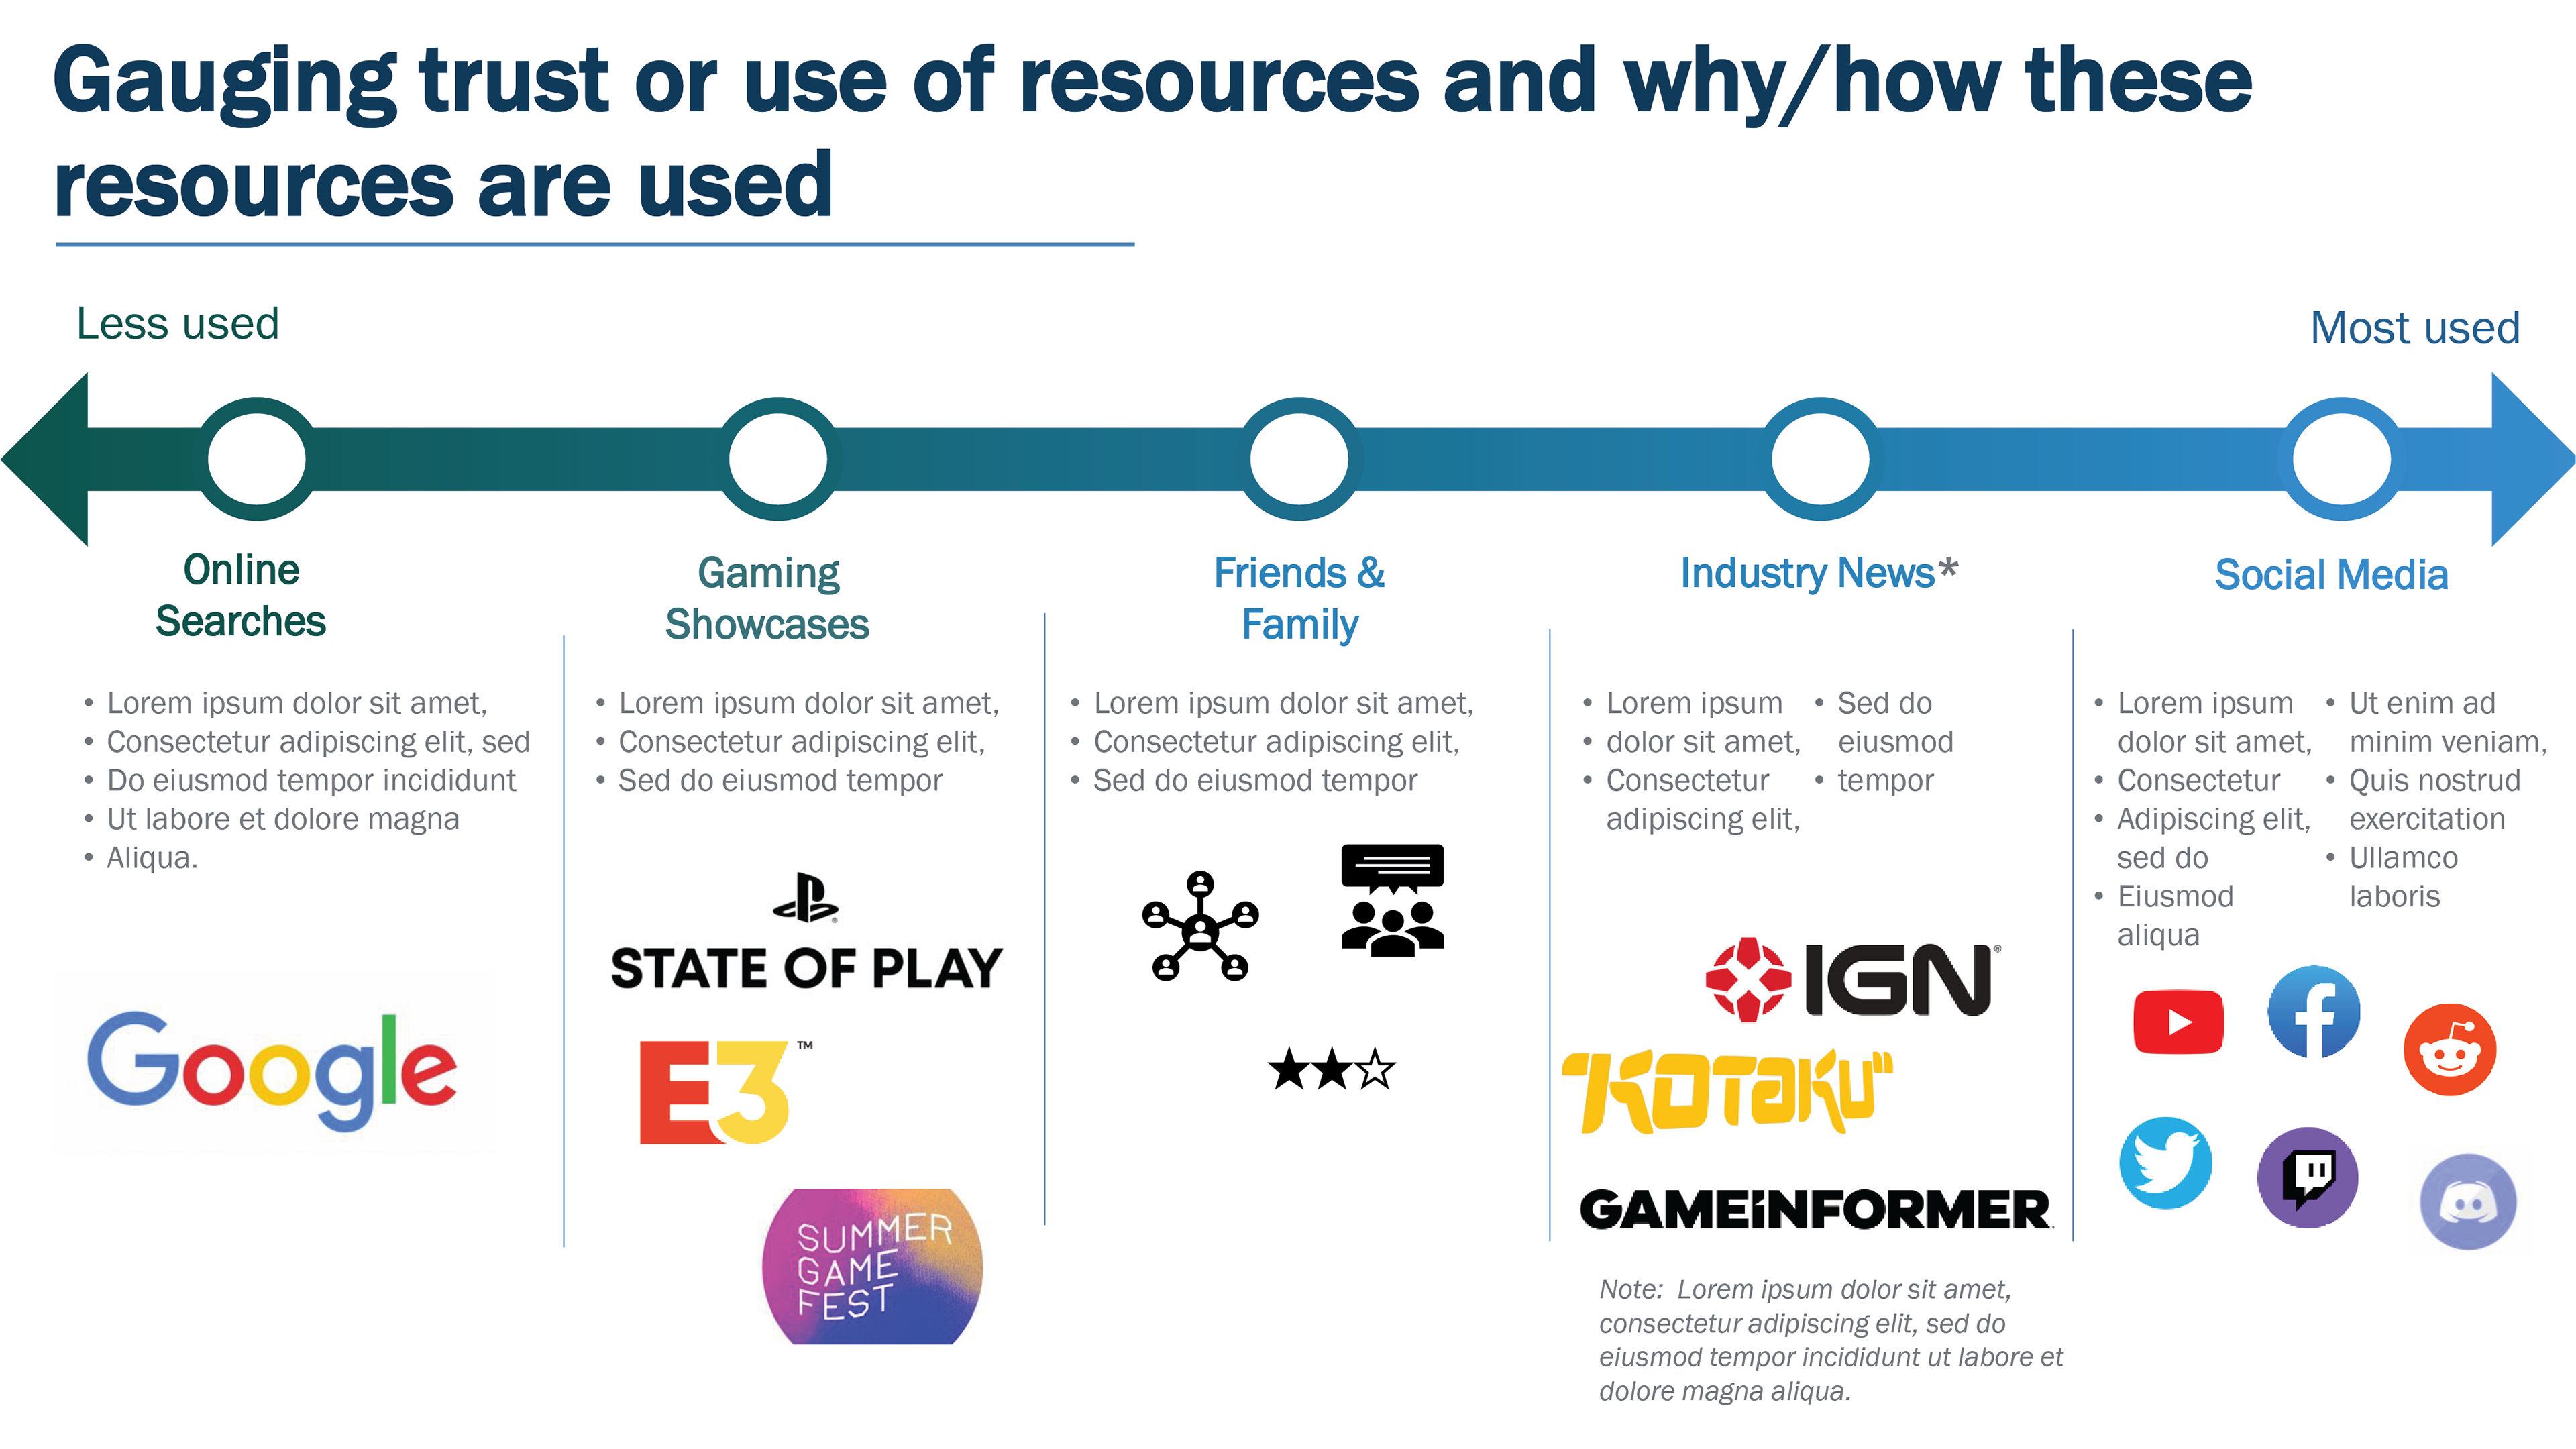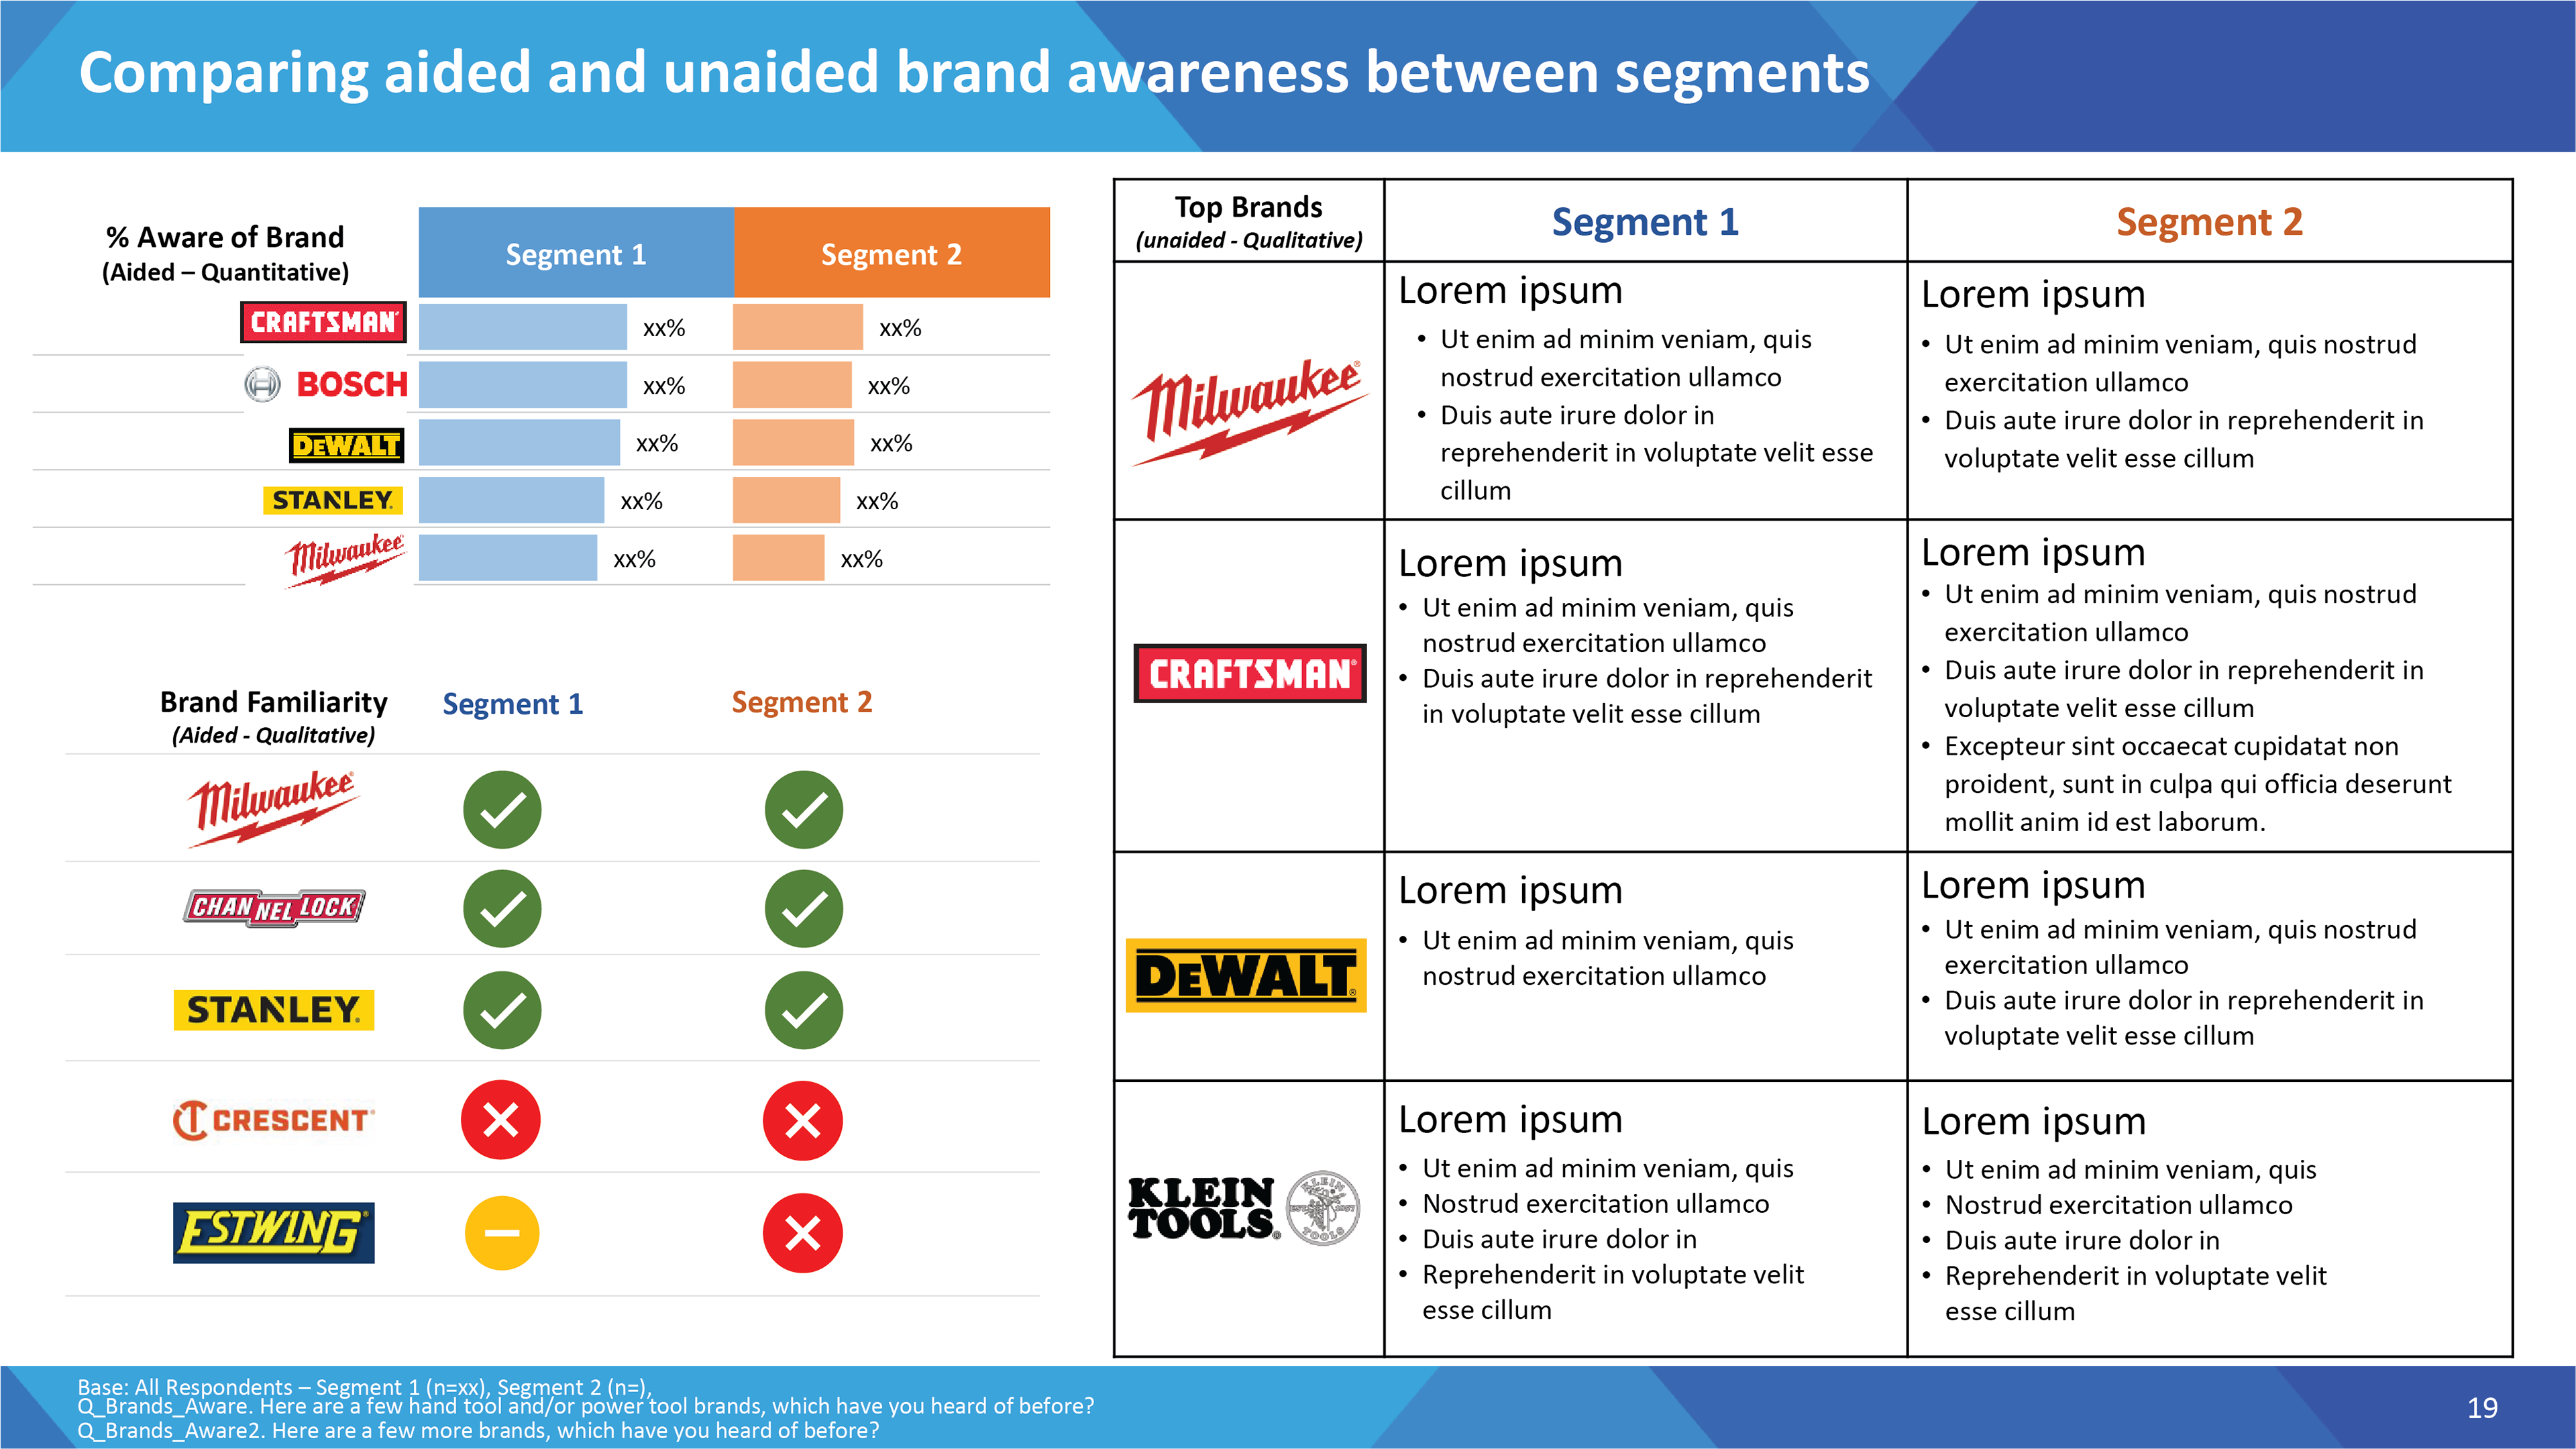
Chart & Table Design
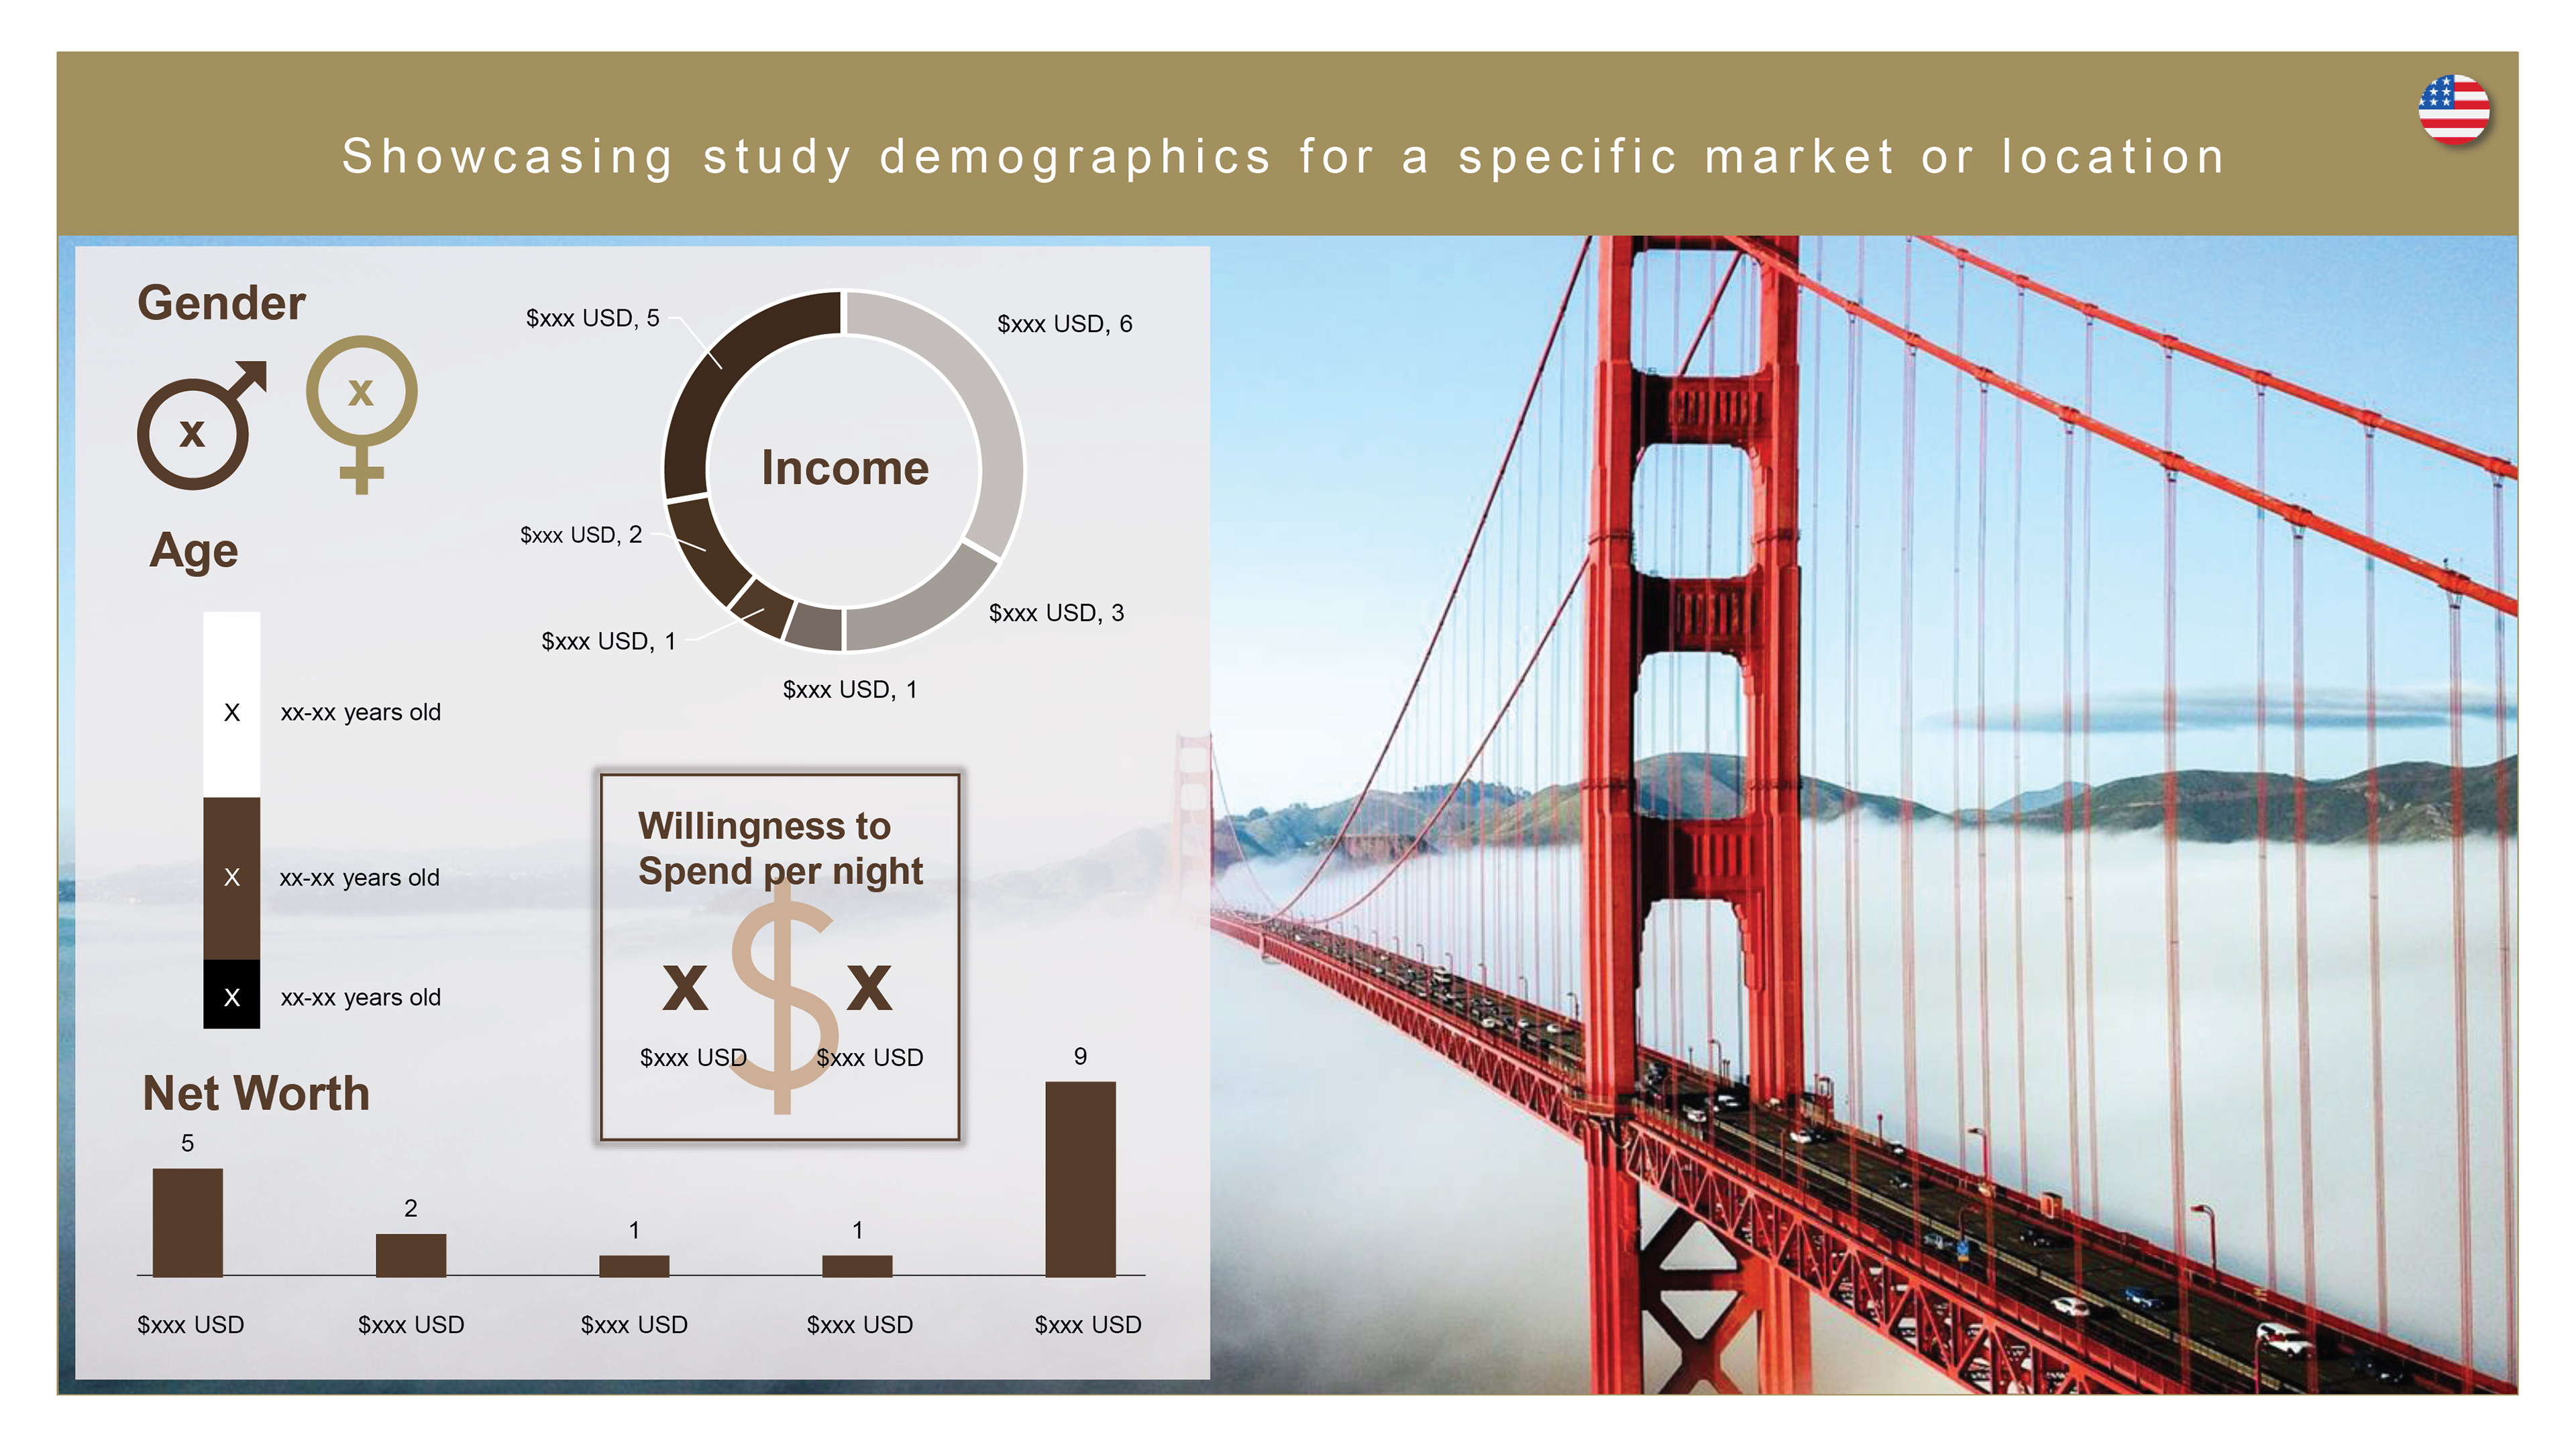
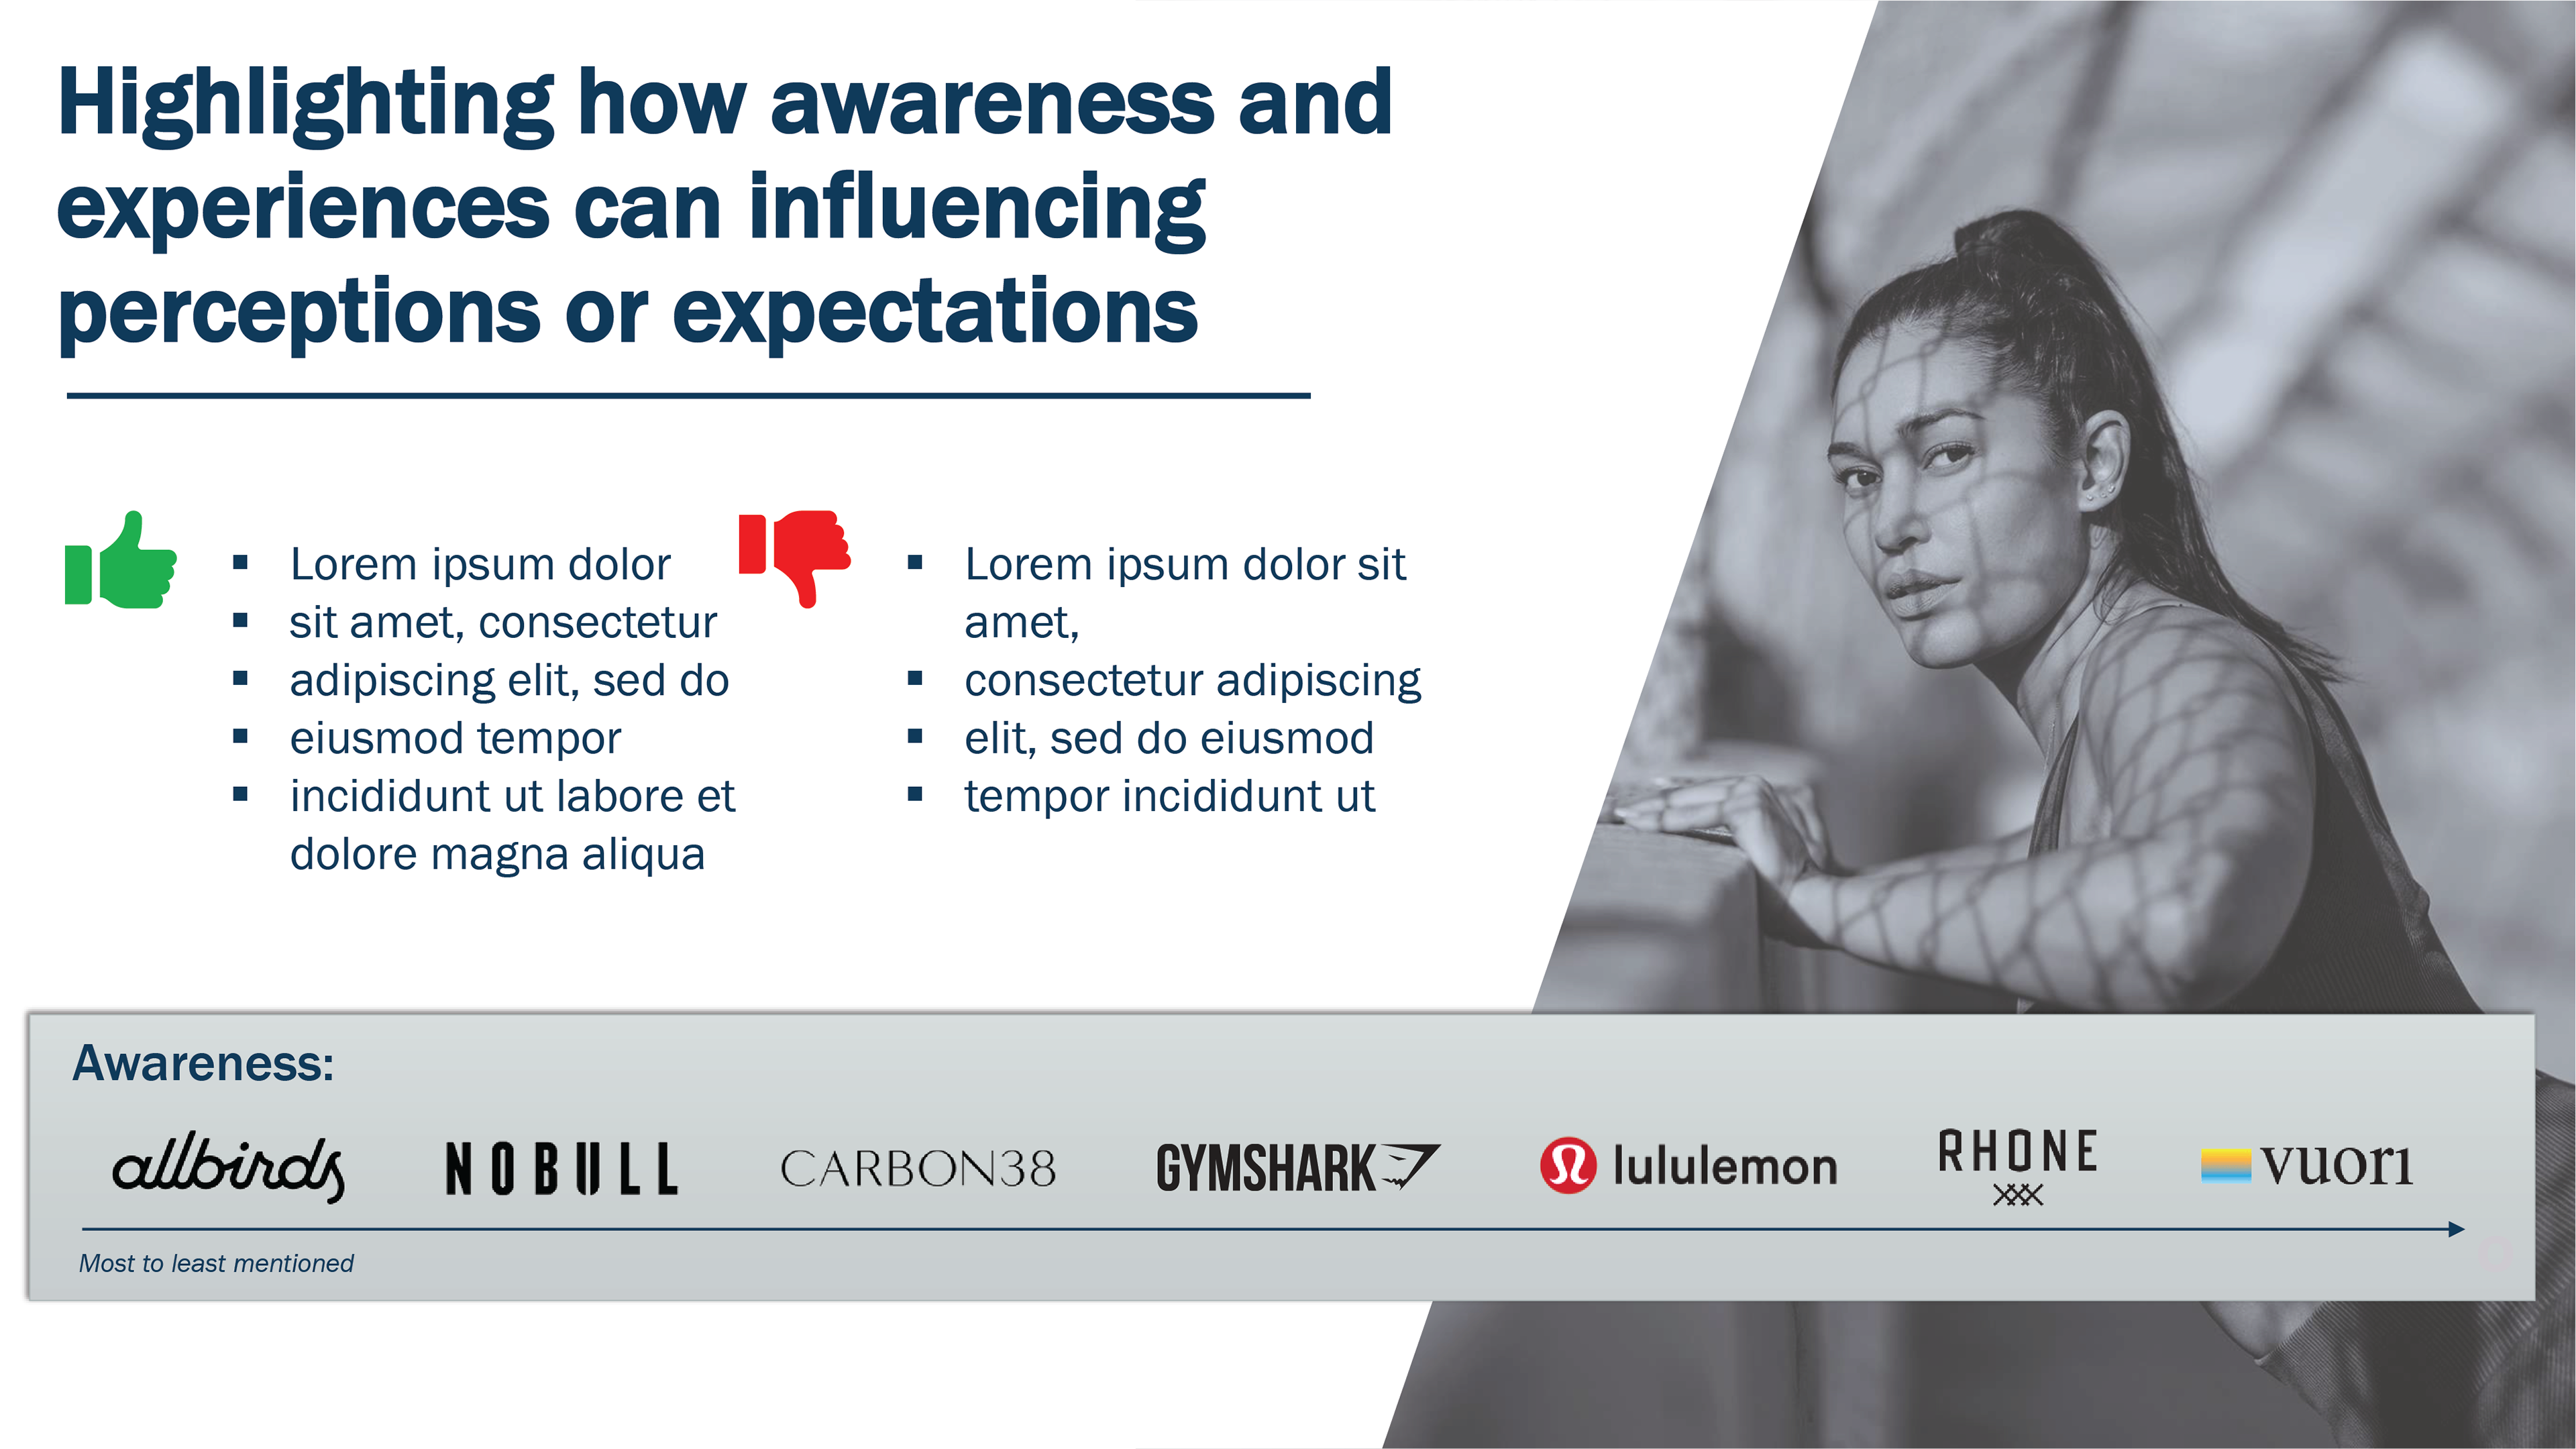
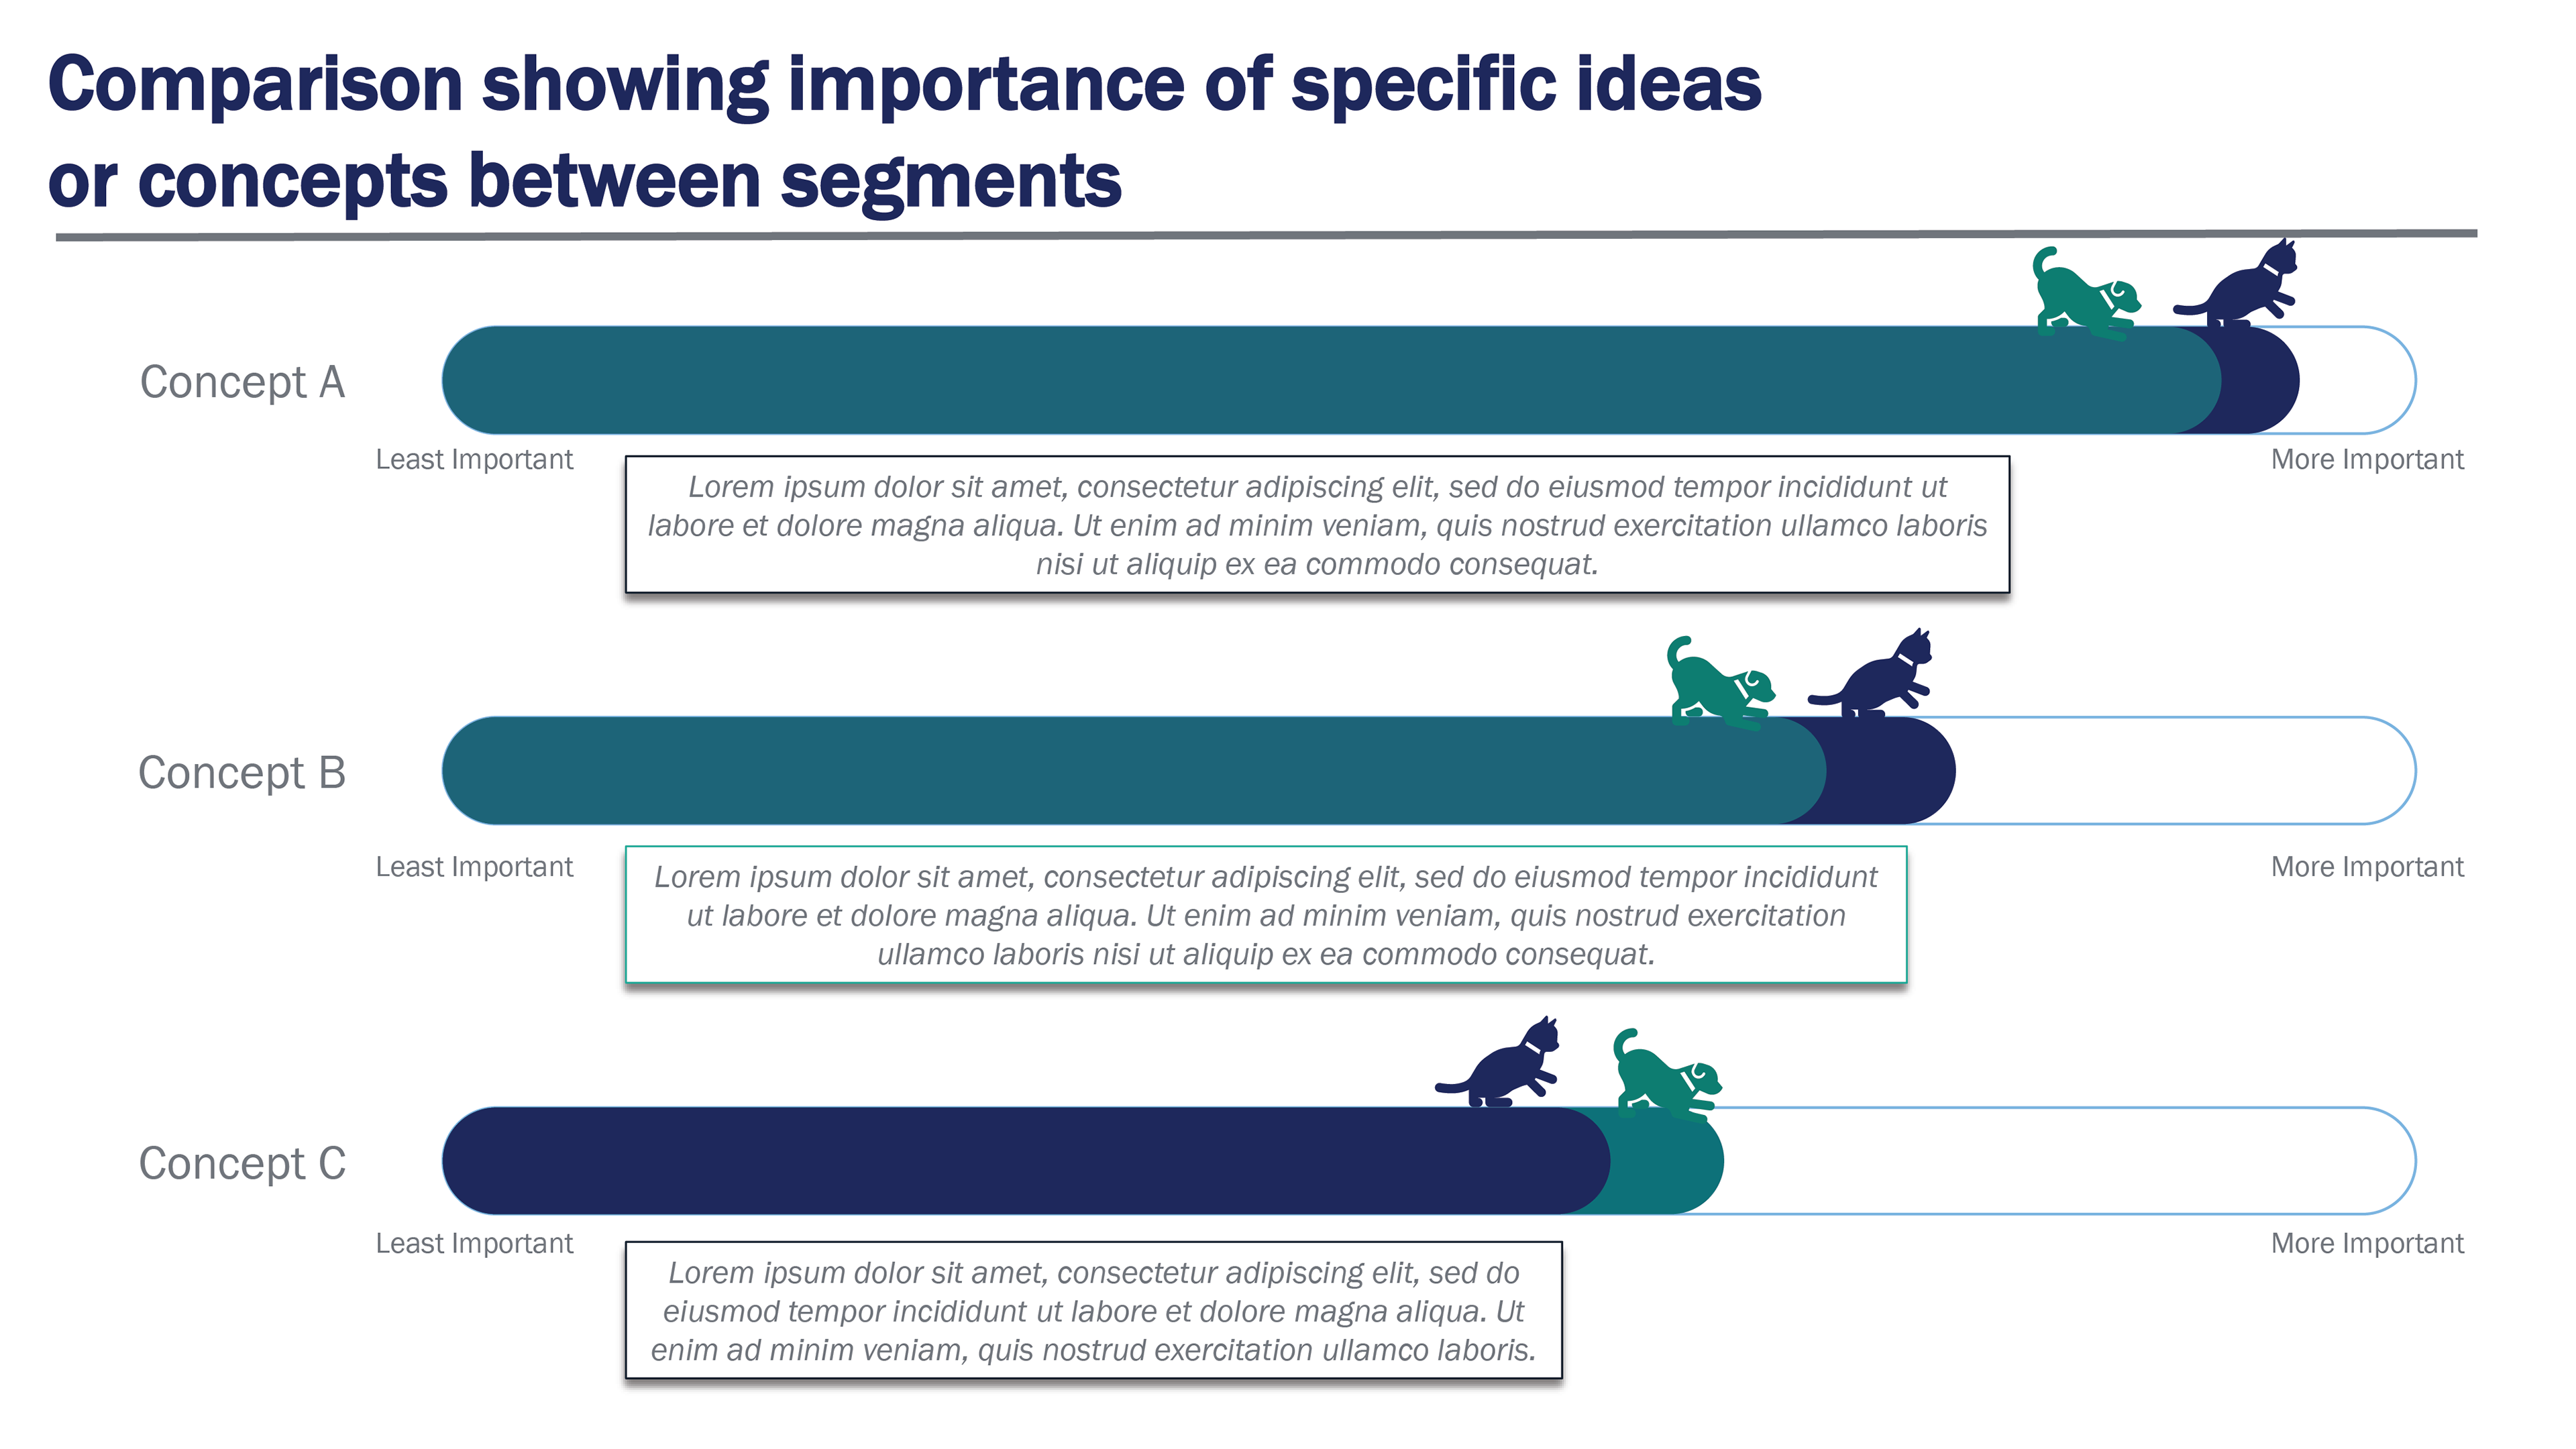
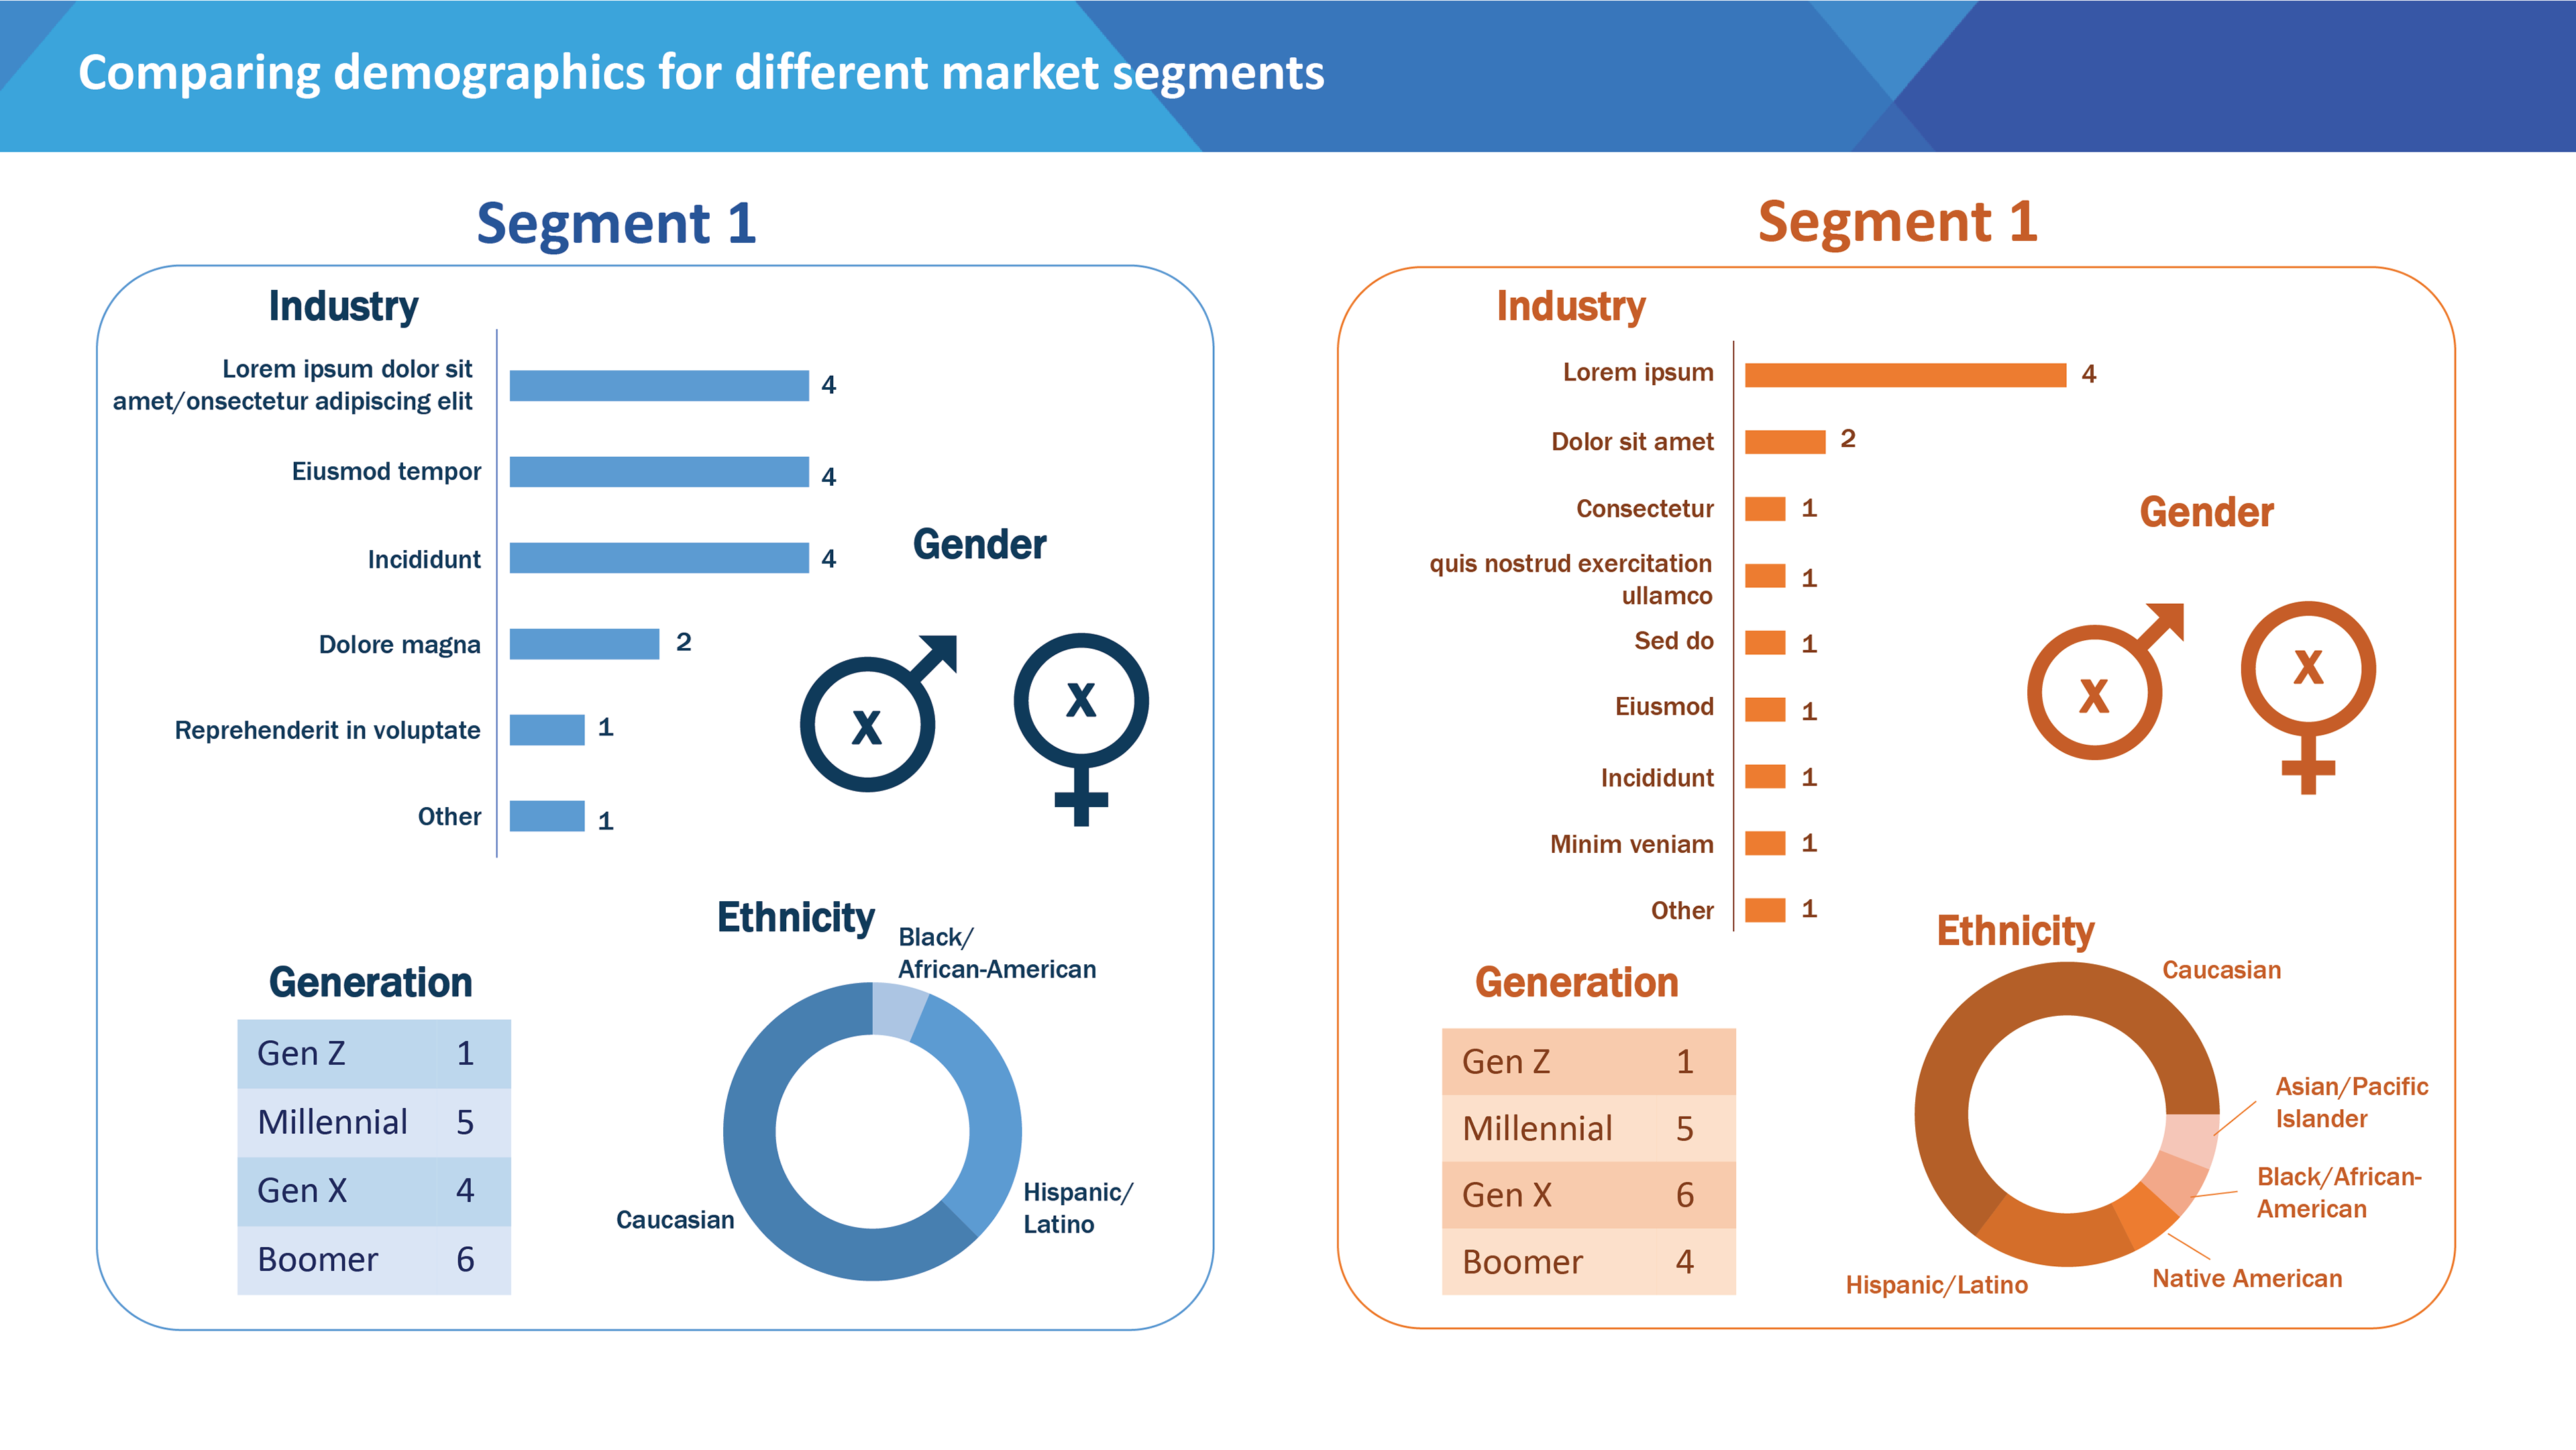
Purpose: Help communicate to and organization the preferences and/or level of awareness consumers/users have for certain products or experiences over others, as well as illustrate how well that organization’s messaging is resonating with audiences or target populations.